

-
Raman Spectroscopy Measurements of the Pressure−Temperature Behavior of LiAlH4
J.C. Fallas, W.-M. Chien, D. Chandra, V.K. Kamisetty, E.D. Emmons, A.M. Covington, R. Chellappa, S.A. Gramsch, R.J. Hemley and H. Hagemann
Journal of Physical Chemistry C, 114 (27) (2010), p11991-11997


DOI:10.1021/jp1015017 | unige:14747 | Abstract | Article HTML | Article PDF
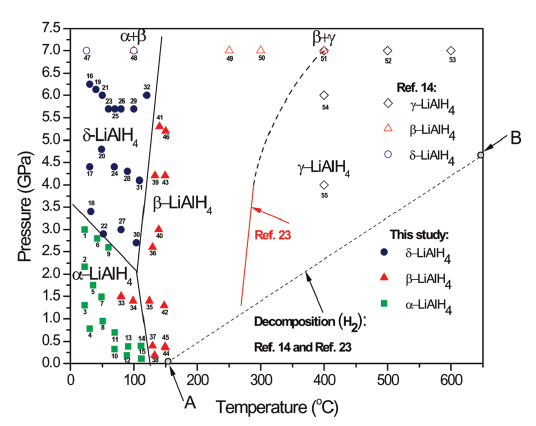
The pressure/temperature phase diagram of LiAlH4 has been constructed by using Raman spectroscopy data. In situ high pressureâtemperature experiments were carried out using resistively heated diamond anvil cells up to 150 °C and 7 GPa. Room temperature phase transitions of monoclinic α-LiAlH4 â δ-LiAlH4 were observed at ~3.2 GPa. As the temperature is increased to ~100 °C, both the α and δ phases transform to β-LiAlH4 and remain stable up to 5.5 GPa. At temperatures greater than 300 °C, a new γ-LiAlH4 phase forms. Data of Konovalov (1995) has been used to define the phase boundary between β- and γ-LiAlH4 phases. We present a pressureâtemperature phase diagram of LiAlH4 based using diamond anvil cells coupled with Raman spectroscopy.